Torte Dashboard
- Categories: Student Project, Web Development, Vue
- Project date: May, 2025
- Project URL: https://github.com//lupeterm/torte-dashboard
Project Description
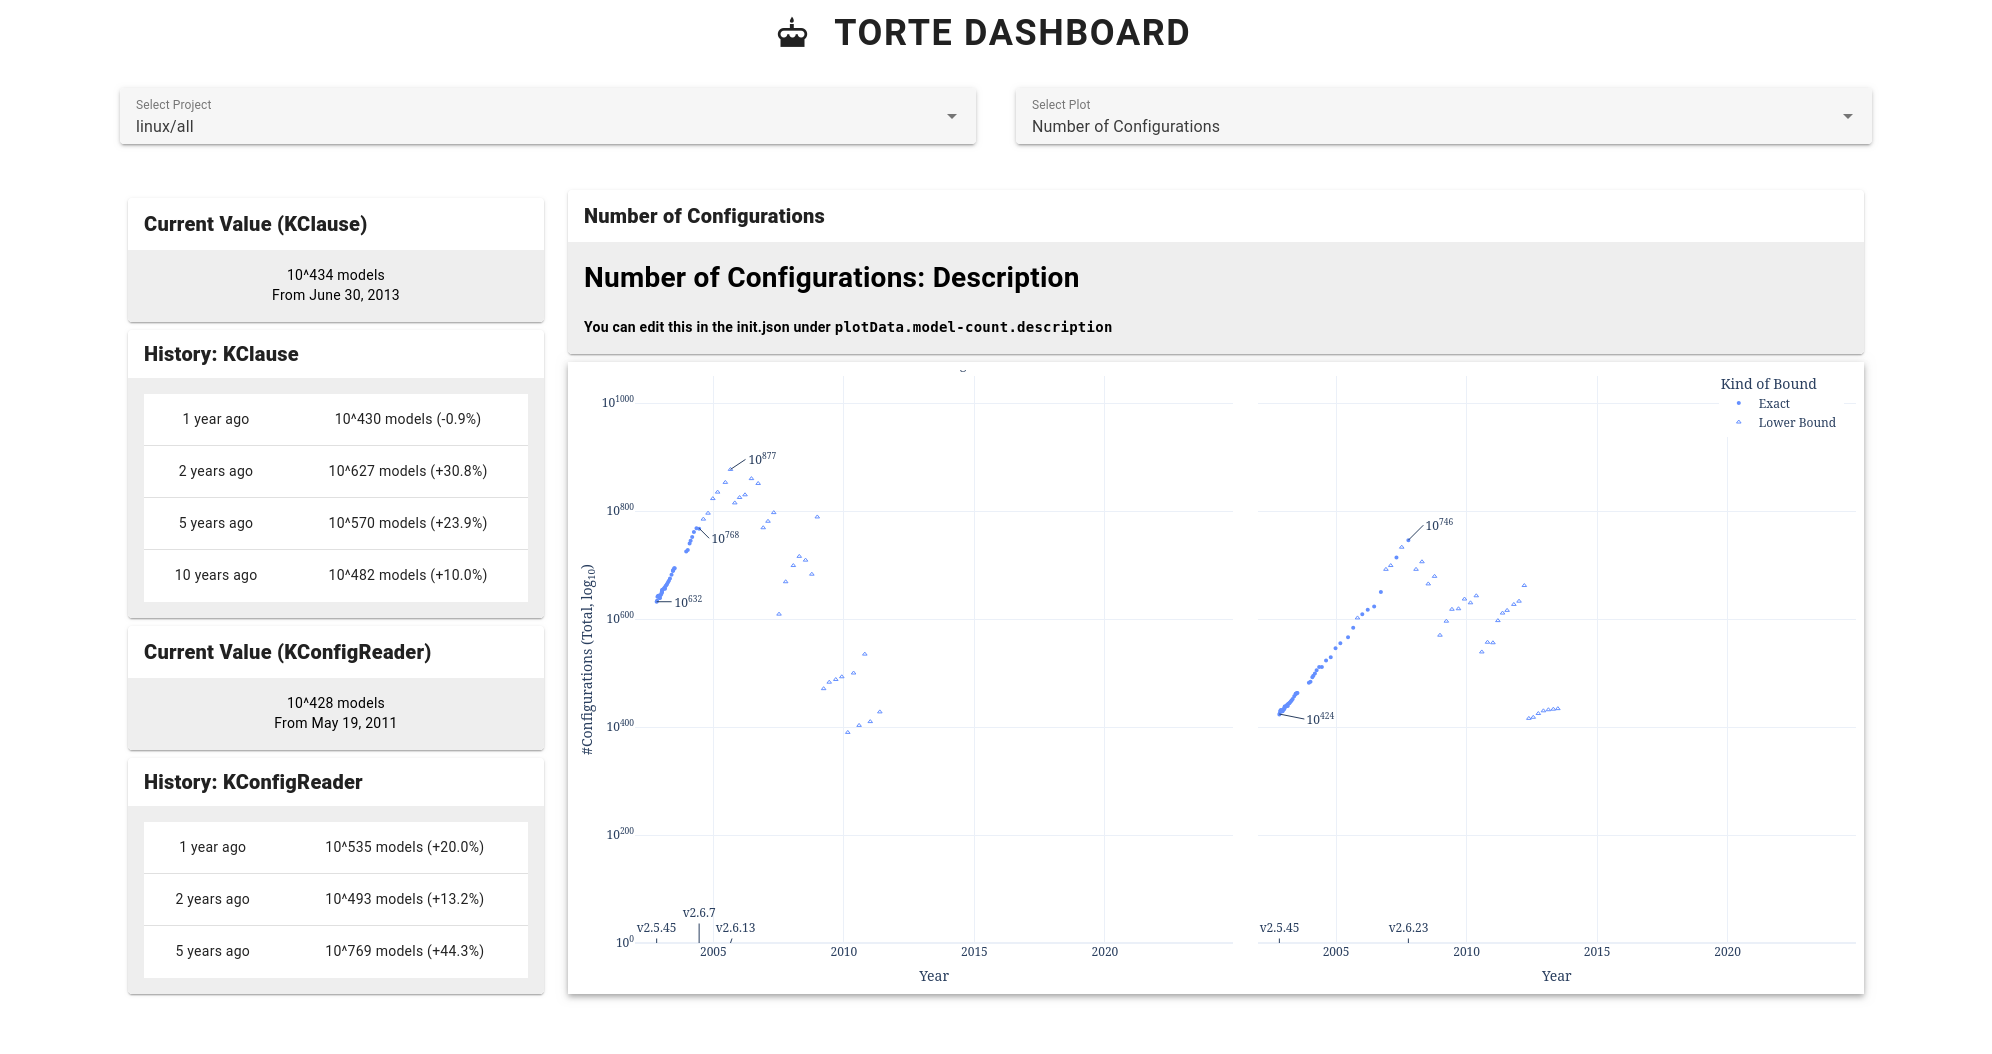
Modern system software is highly configurable. So configurable, that the exact number of configurations of the linux kernel couldn't be exactly determined since 2005. To aid researchers in publishing their results in an easy and scalable way, a dashboard for the visualization of TORTE experiment results was created. The dashboard includes a "backend" which automatically converts .csv result files of a project to interactive plots which are imported as iframes. The frontend part is implemented using vuetify and converted to static html using vite. This allows for a serverless approach in which the dashboard is uploaded, for instance via github pages. For more information, see the slides